Imagery from the Metop Satellites
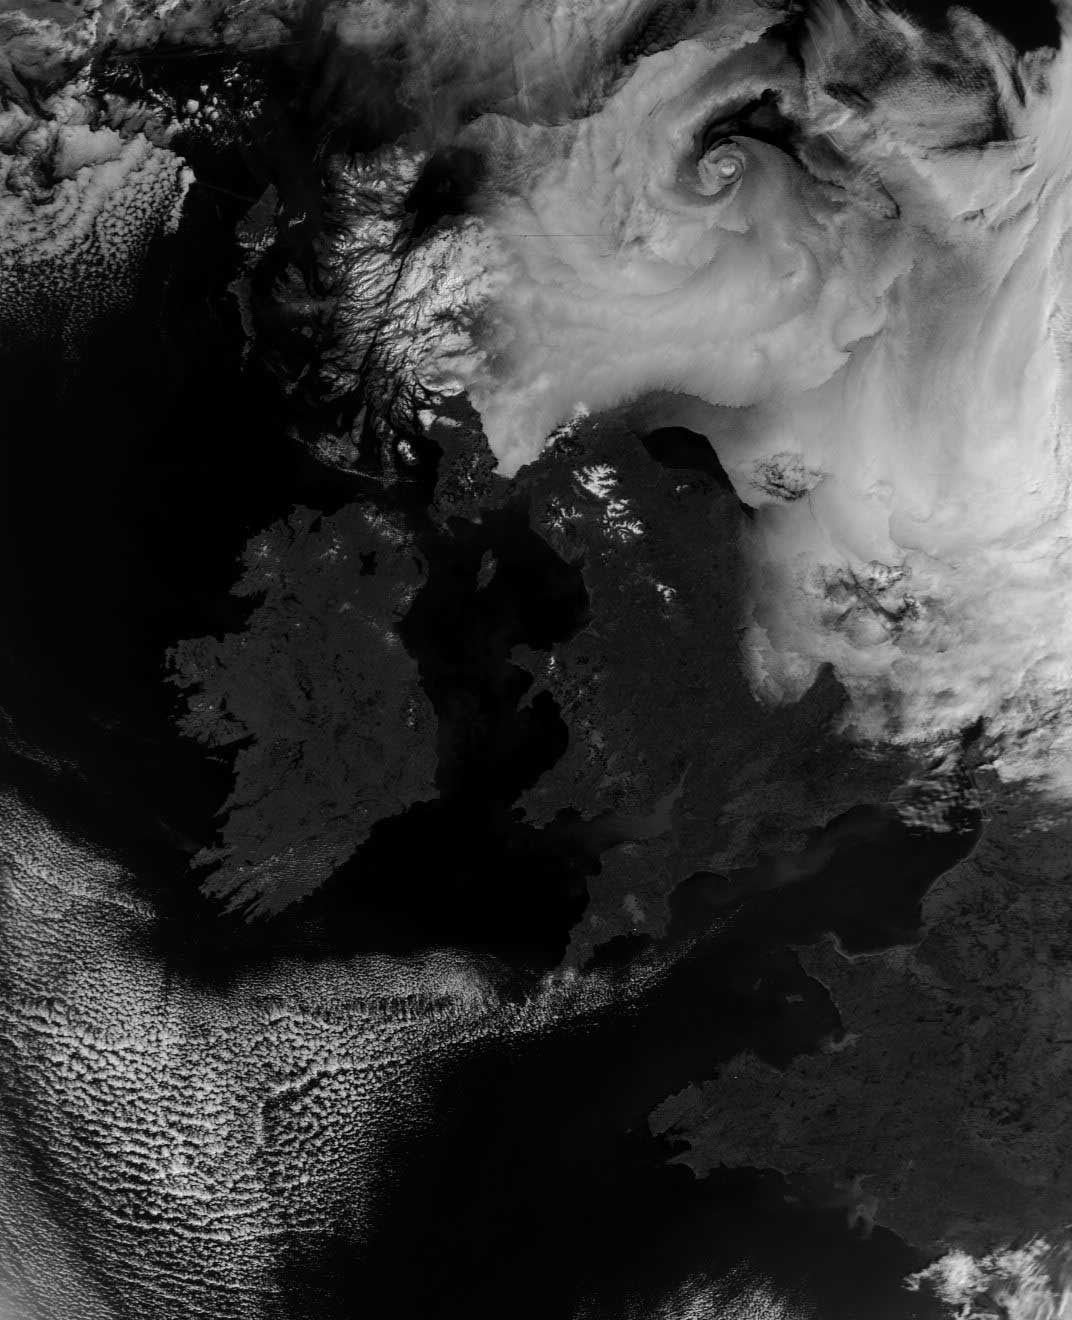
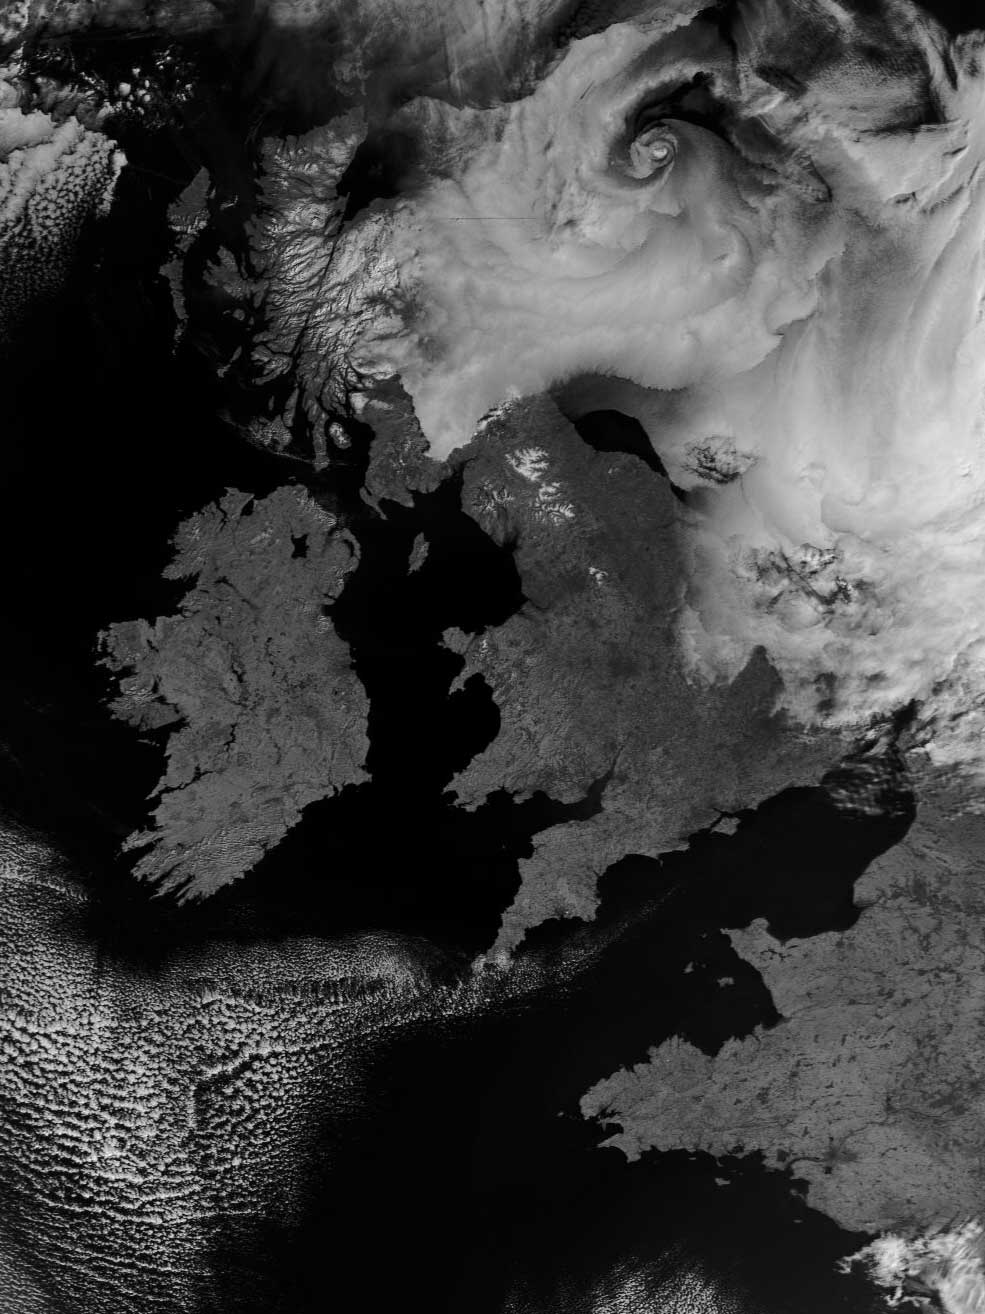
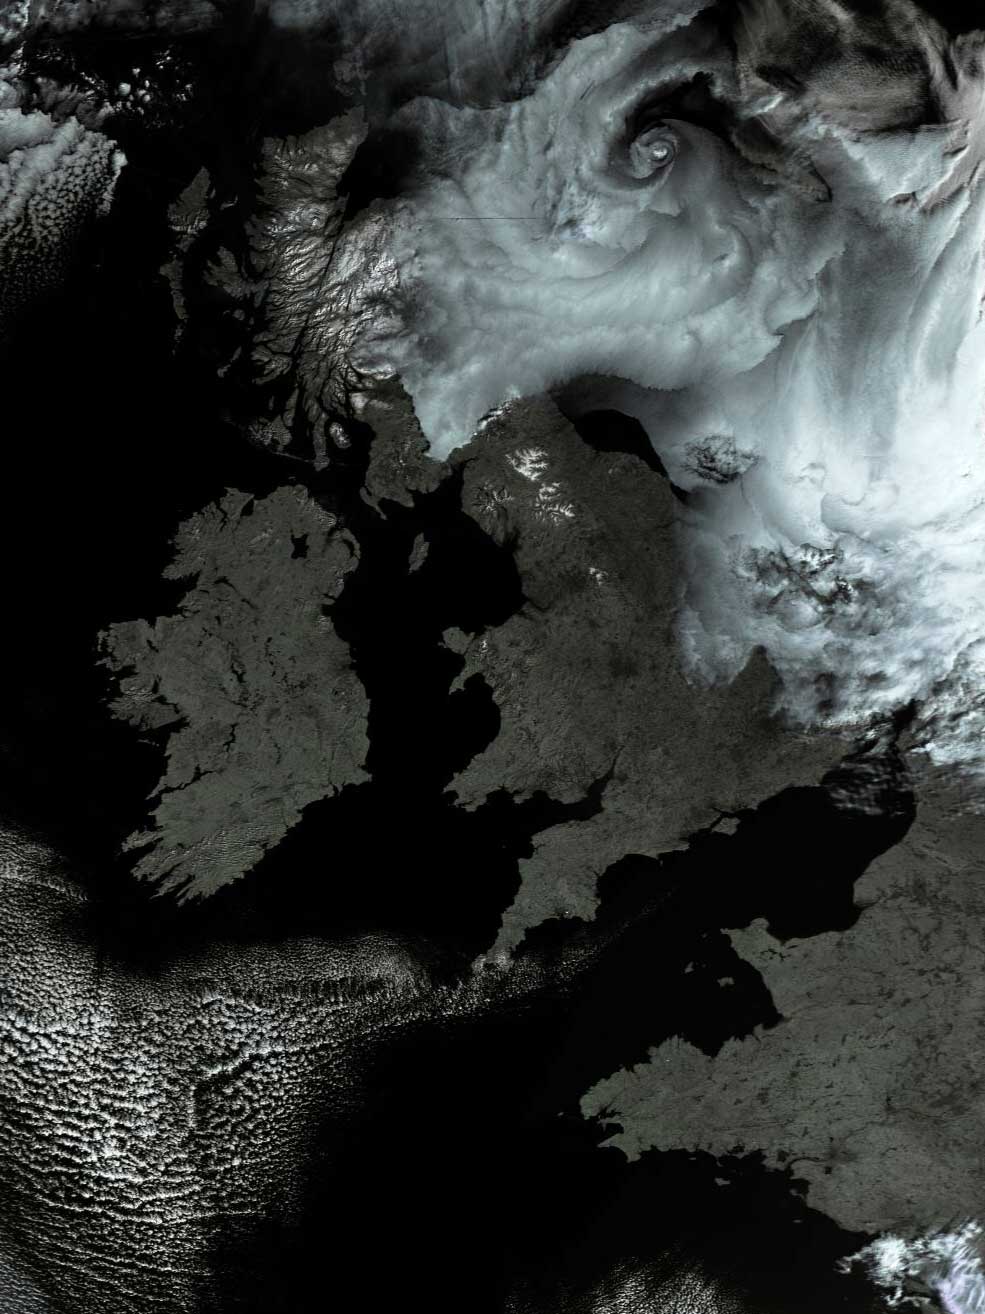
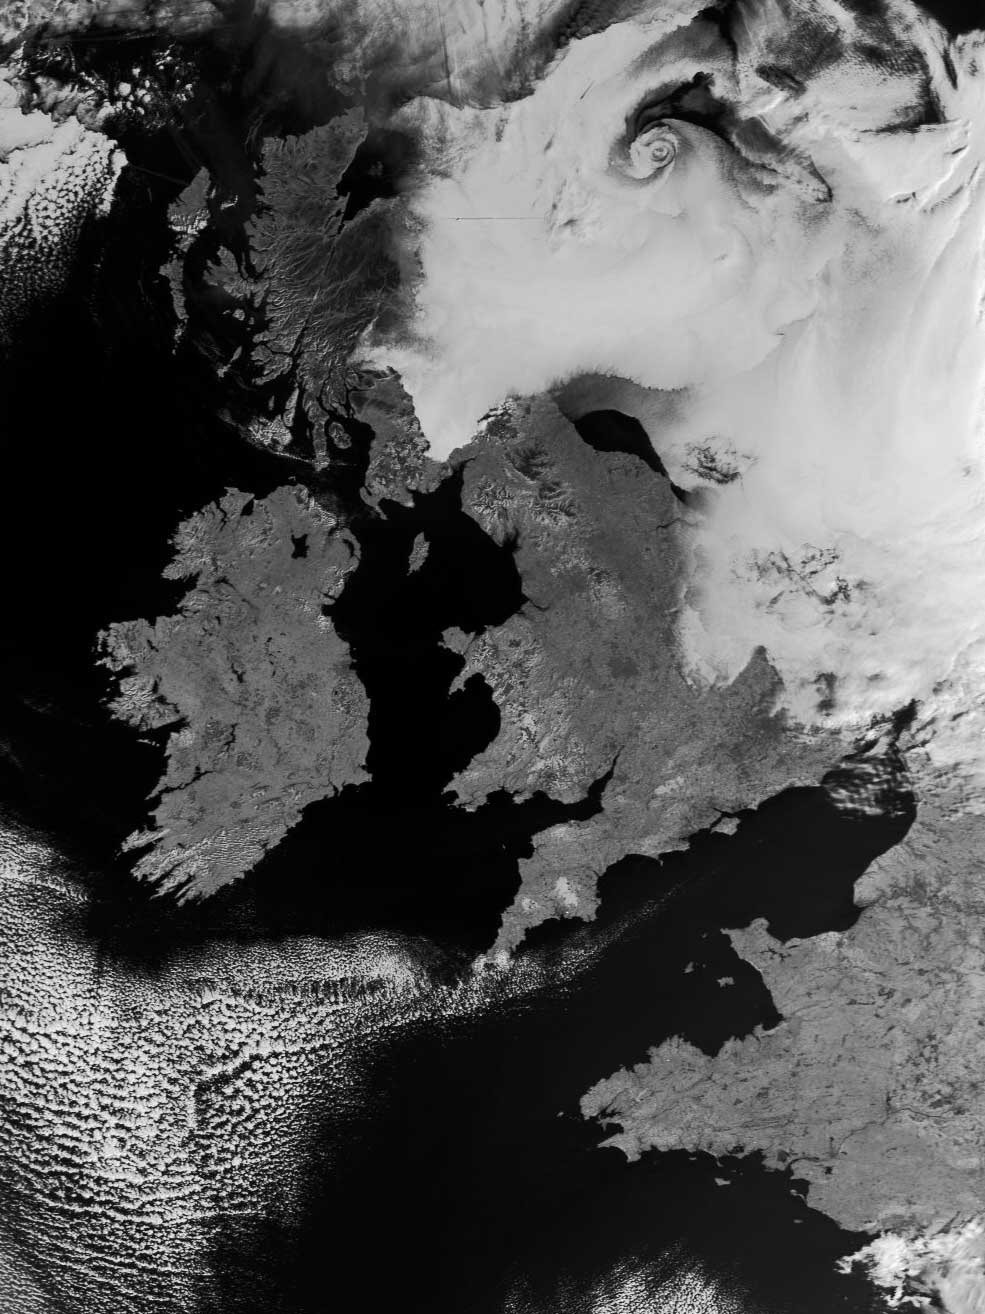
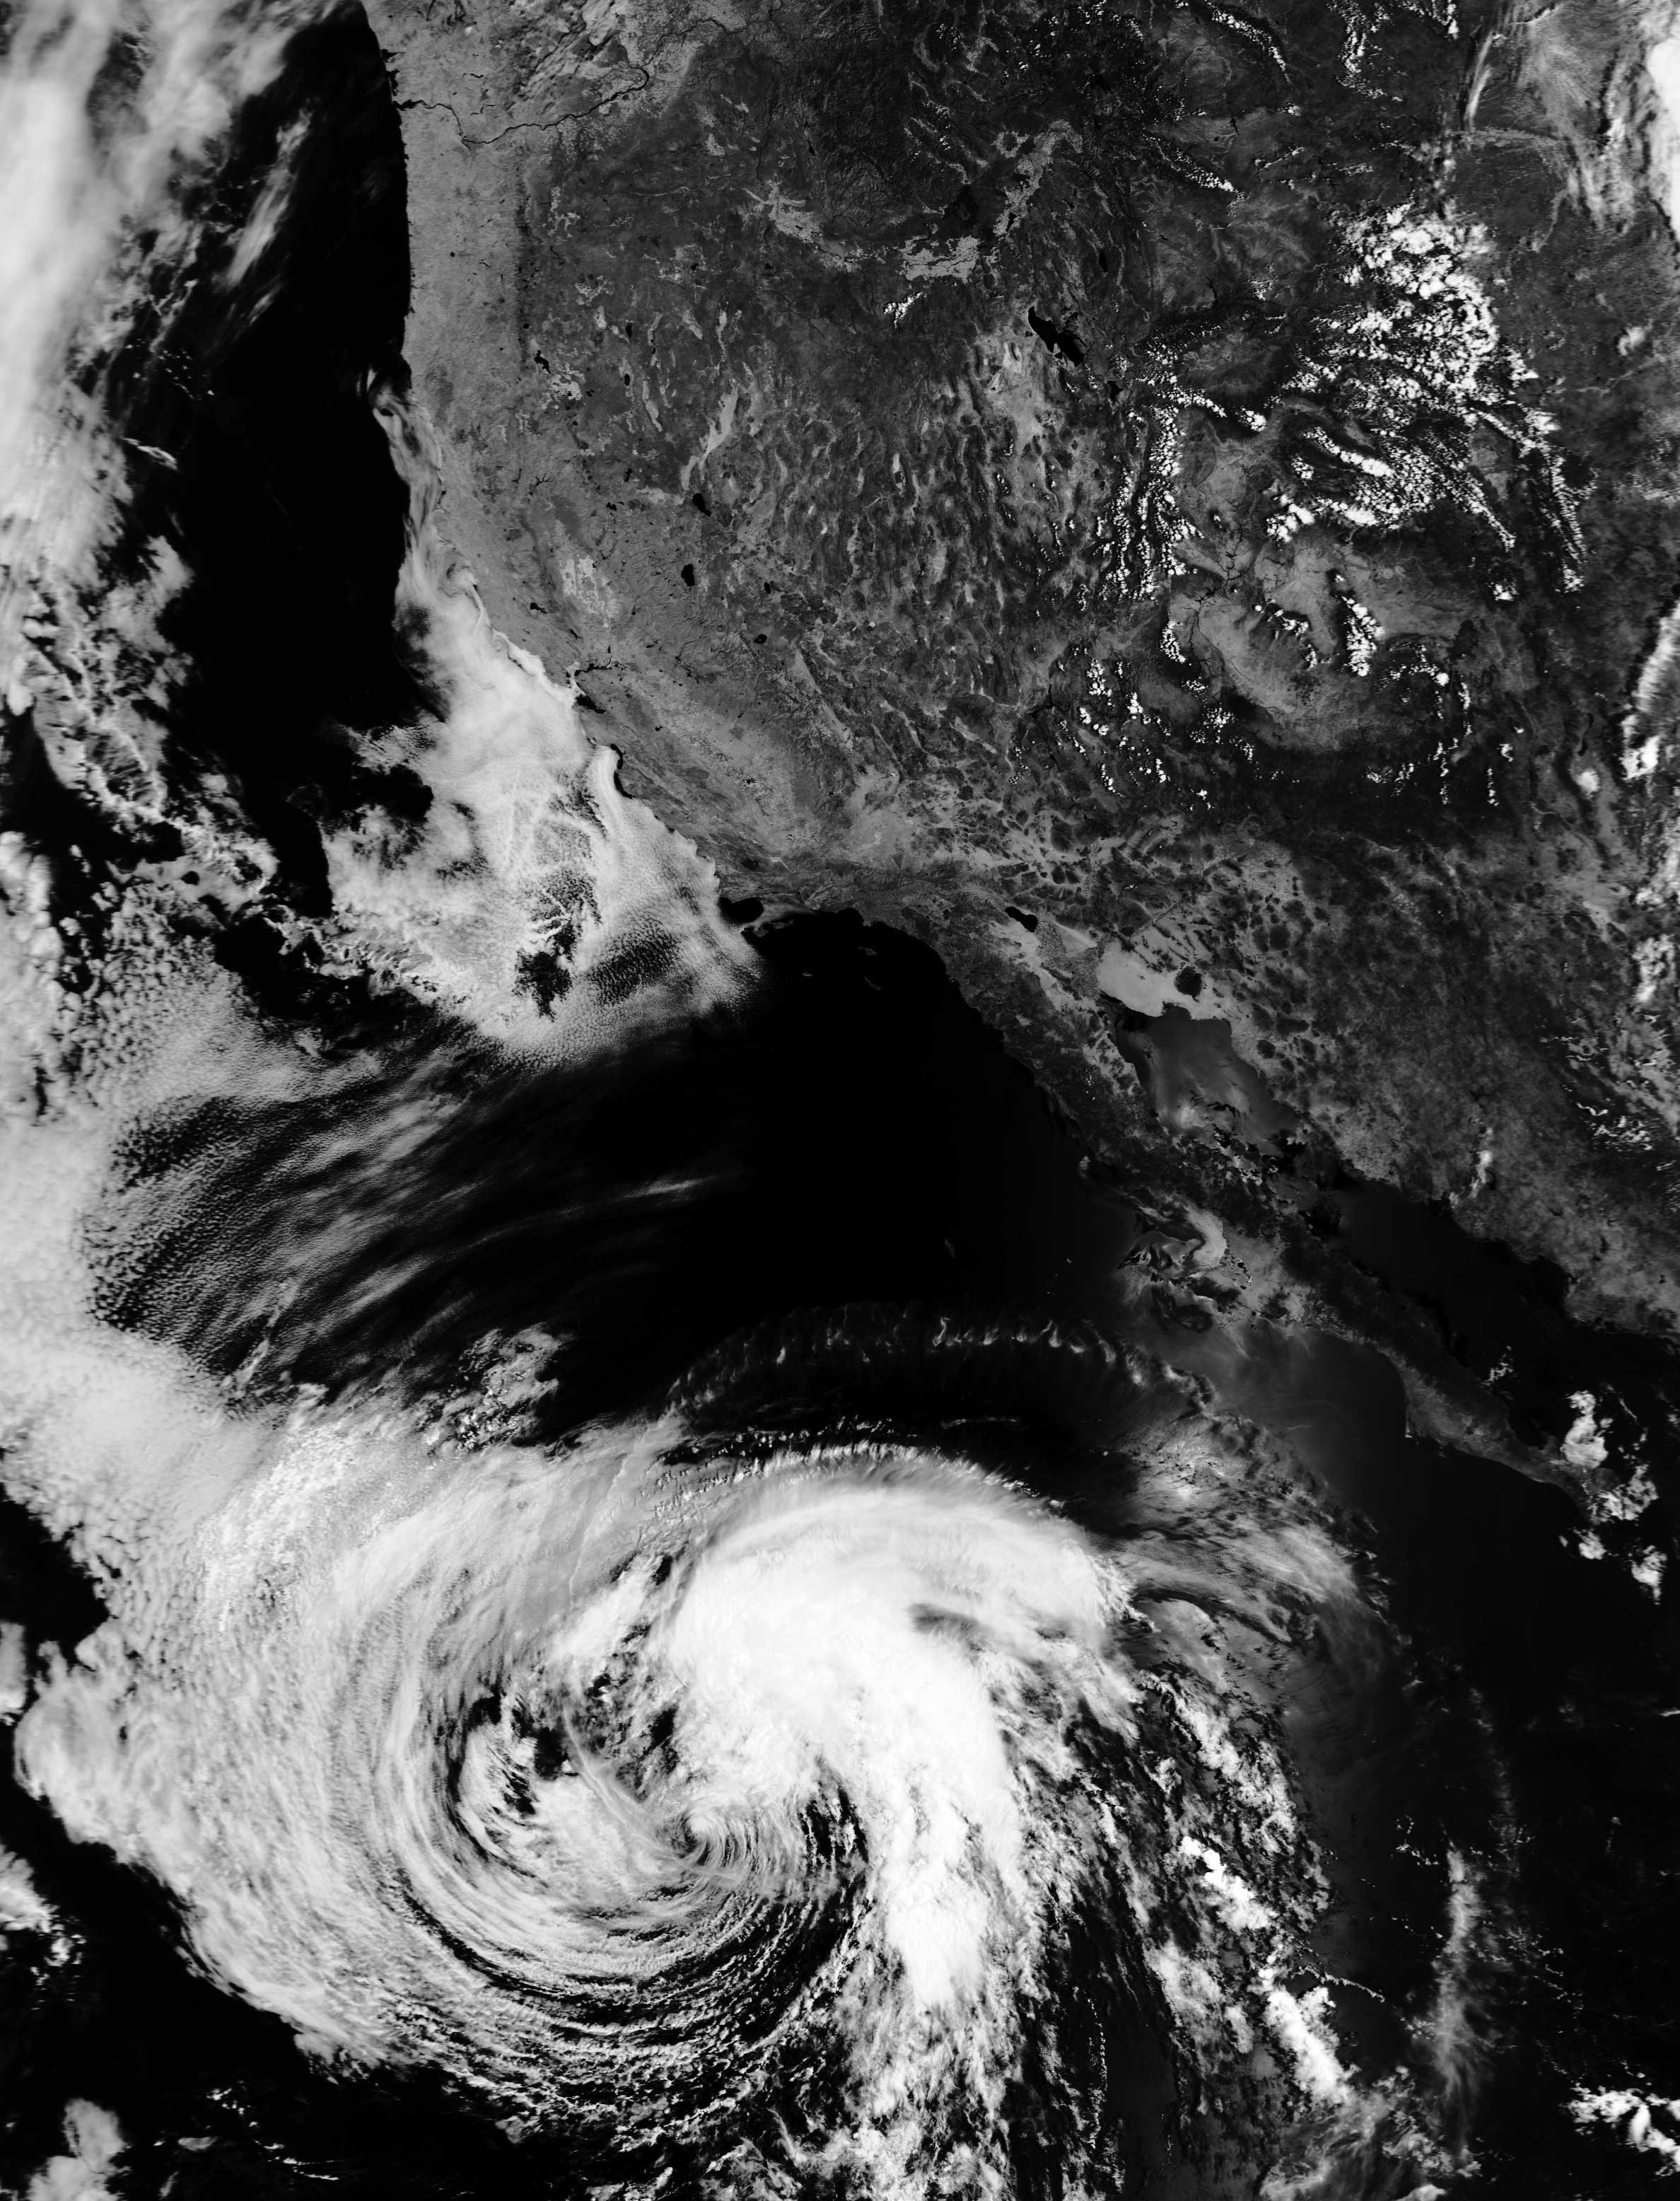
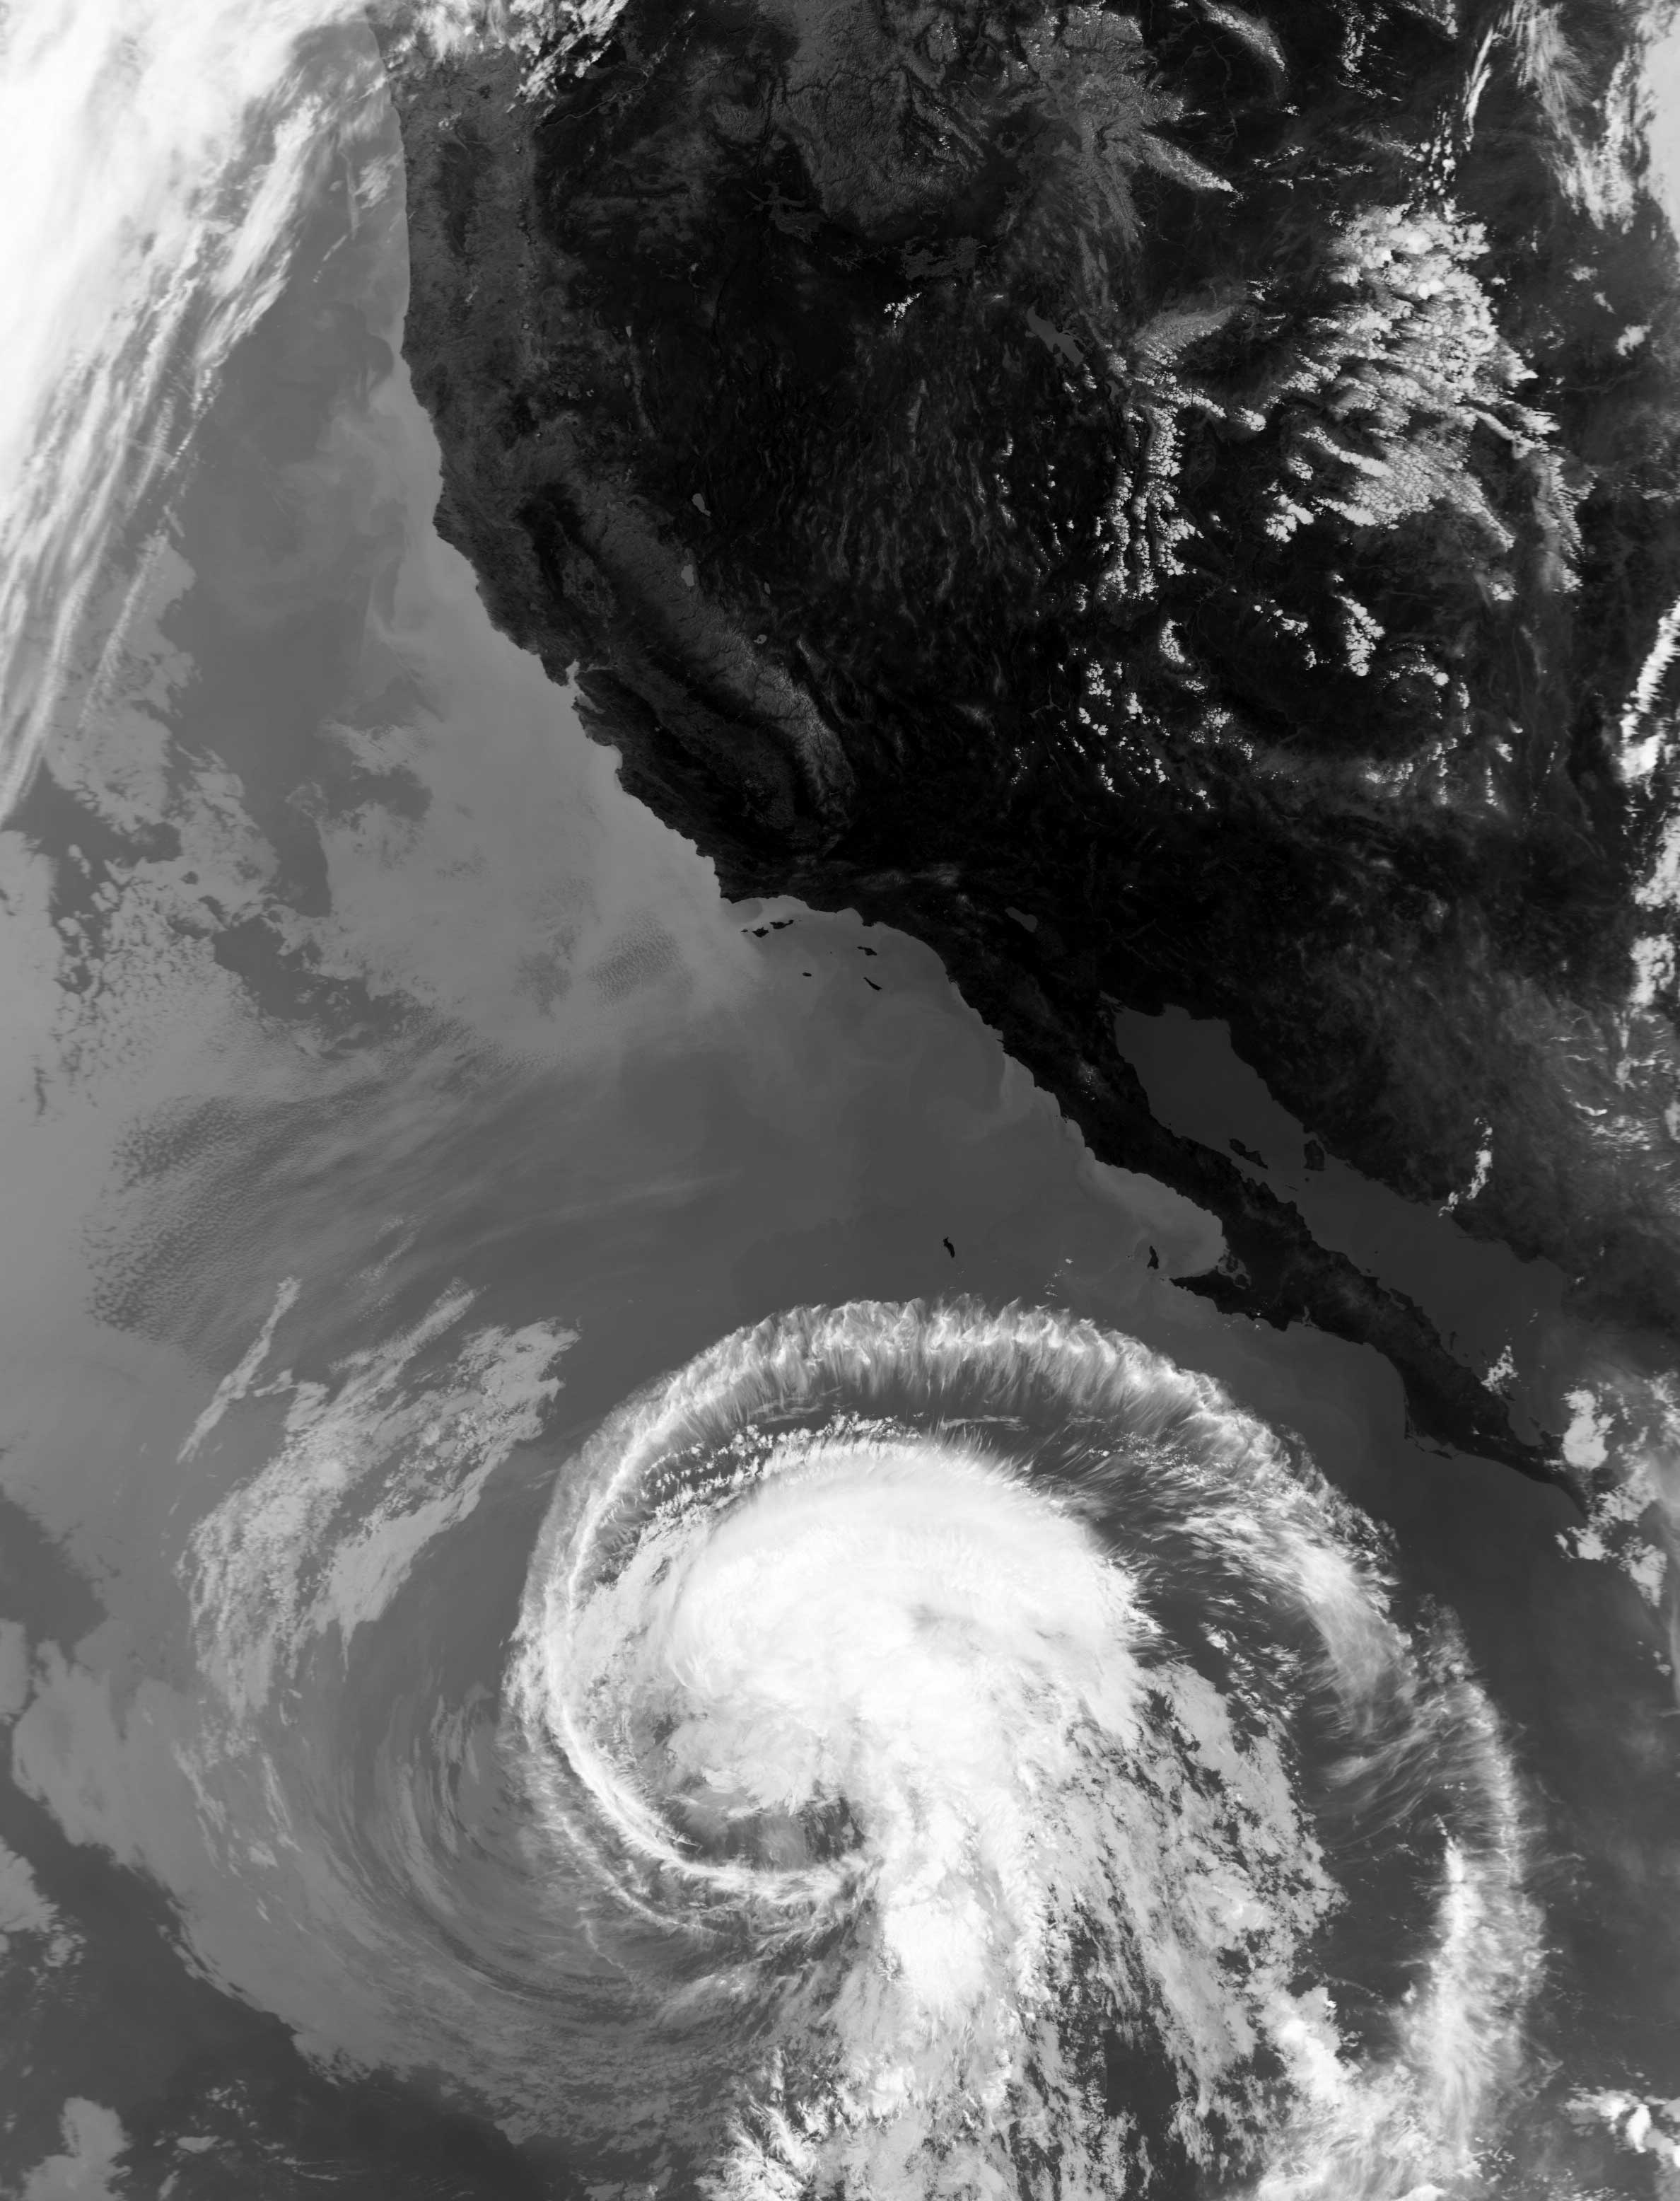
The European Metop satellites image the Earth using the AVHRR3, a six channel scanning radiometer that views the Earth in visible light and infrared (IR). Only five of these channels are active at any one time however, as channels 3A and 3B alternate by day and night. The frequencies are shown in the table below.
| Channel | Wavelength (micrometre) | Uses |
|---|---|---|
| 1 | 0.580-0.680 µm | Daytime cloud and surface mapping |
| 2 | 0.725-1.000 µm | Displaying Landwater boundaries |
| 3A | 1.580-1.640 µm | Snow and ice detection |
| 3B | 3.550-3.930 µm | Night cloud mapping, sea surface temperature |
| 4 | 10.300-11.300 µm | Night cloud mapping, sea surface temperature |
| 5 | 11.500-12.500 µm | Sea surface temperature |
Following are examples of Metop imagery, displaying thumbnails of channels 1 to 4: channel 5 appears almost identical to channel 4, and is not shown. Also displayed is a false-colour composite image, created by combining data from channels 2 and 4. The colour depends on both the intensity of sunlight (channel 2) and the temperatures of cloud, water and land. Consequently, Summer images display more intense colour characteristics compared with images from Spring and Autumn.
Clicking on any of the small images will display it full size
Metop A Data © EUMETSAT
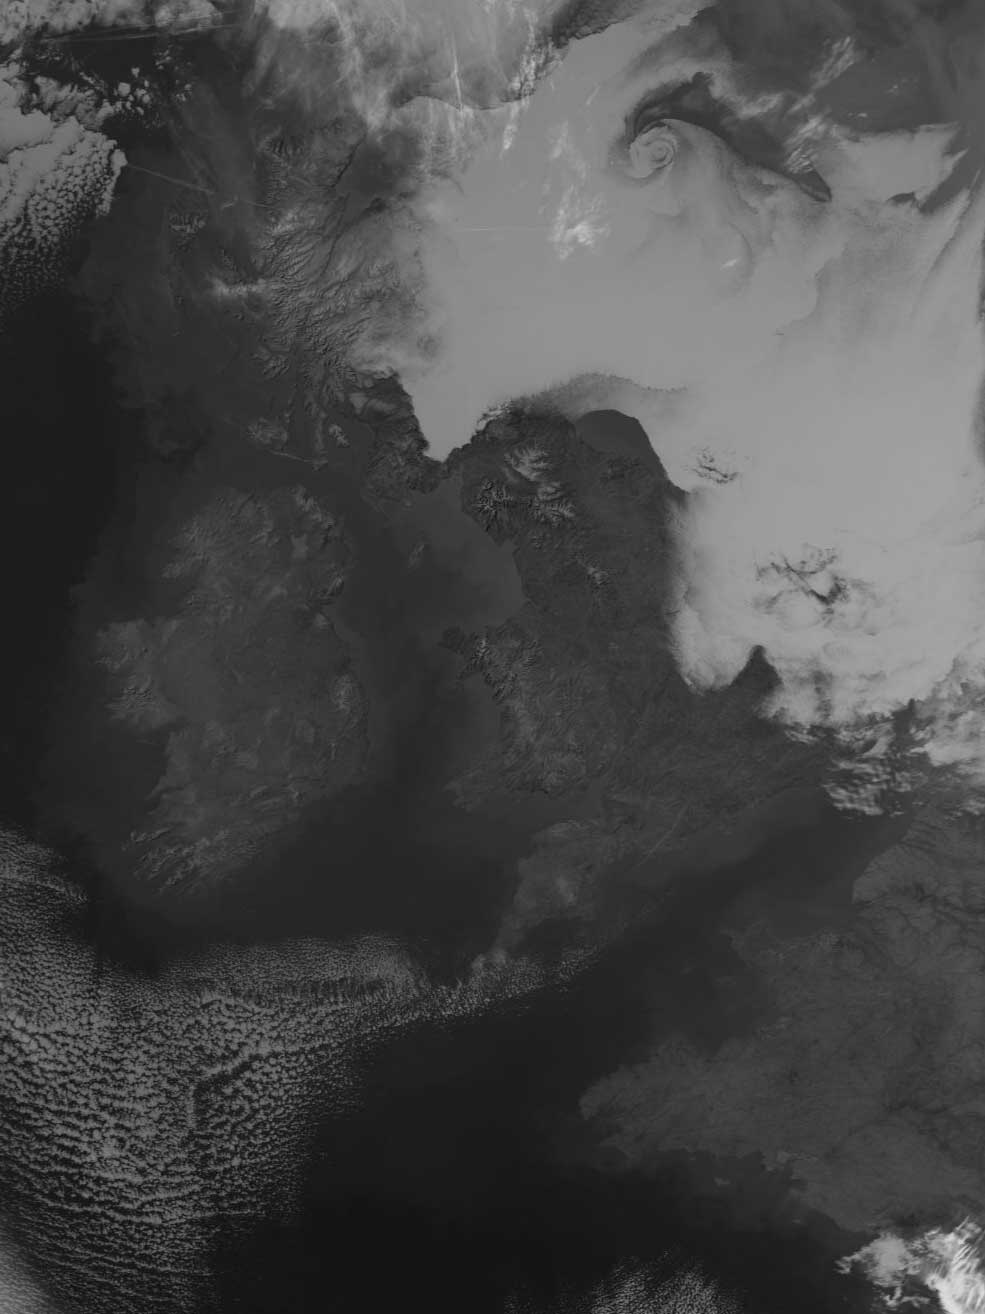
Southbound Metop-A pass at 13.01 UT on March 8, 2010
 |
 |
 |
| Channel 1 | Channel-2 | |
 |
 |
|
| Channel 3 | Channel-4 | Channels 2+4 colour composite |
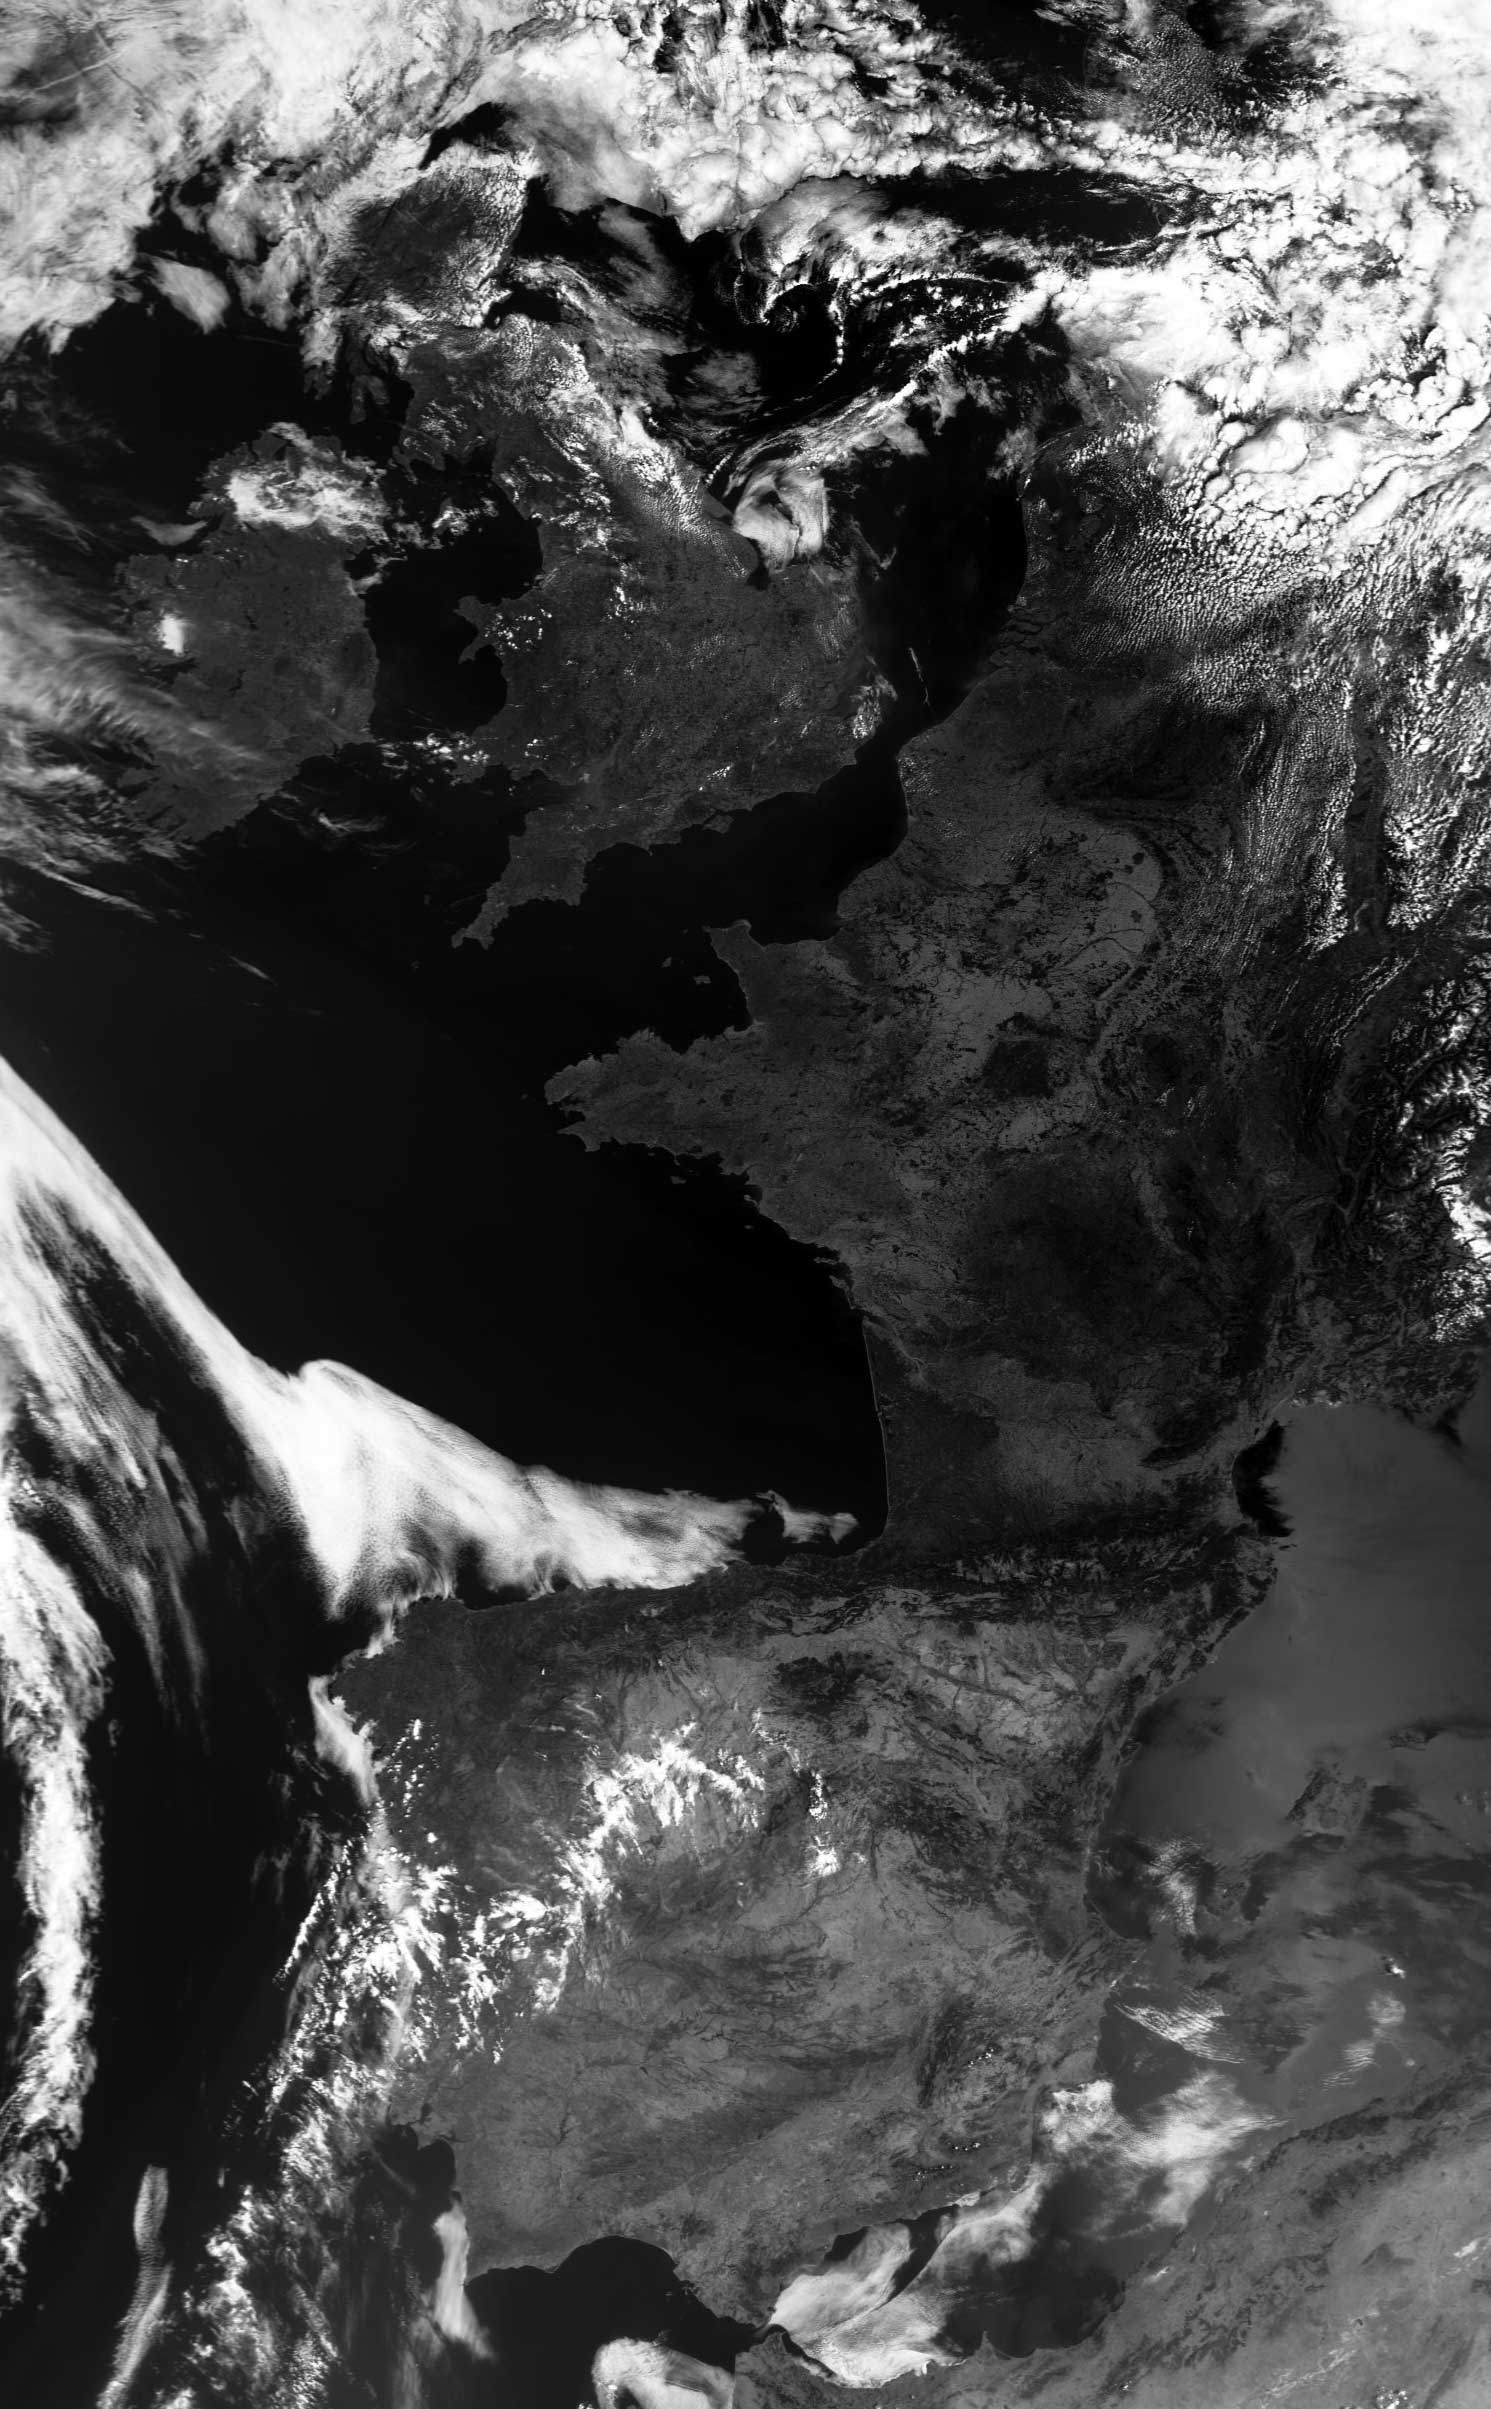
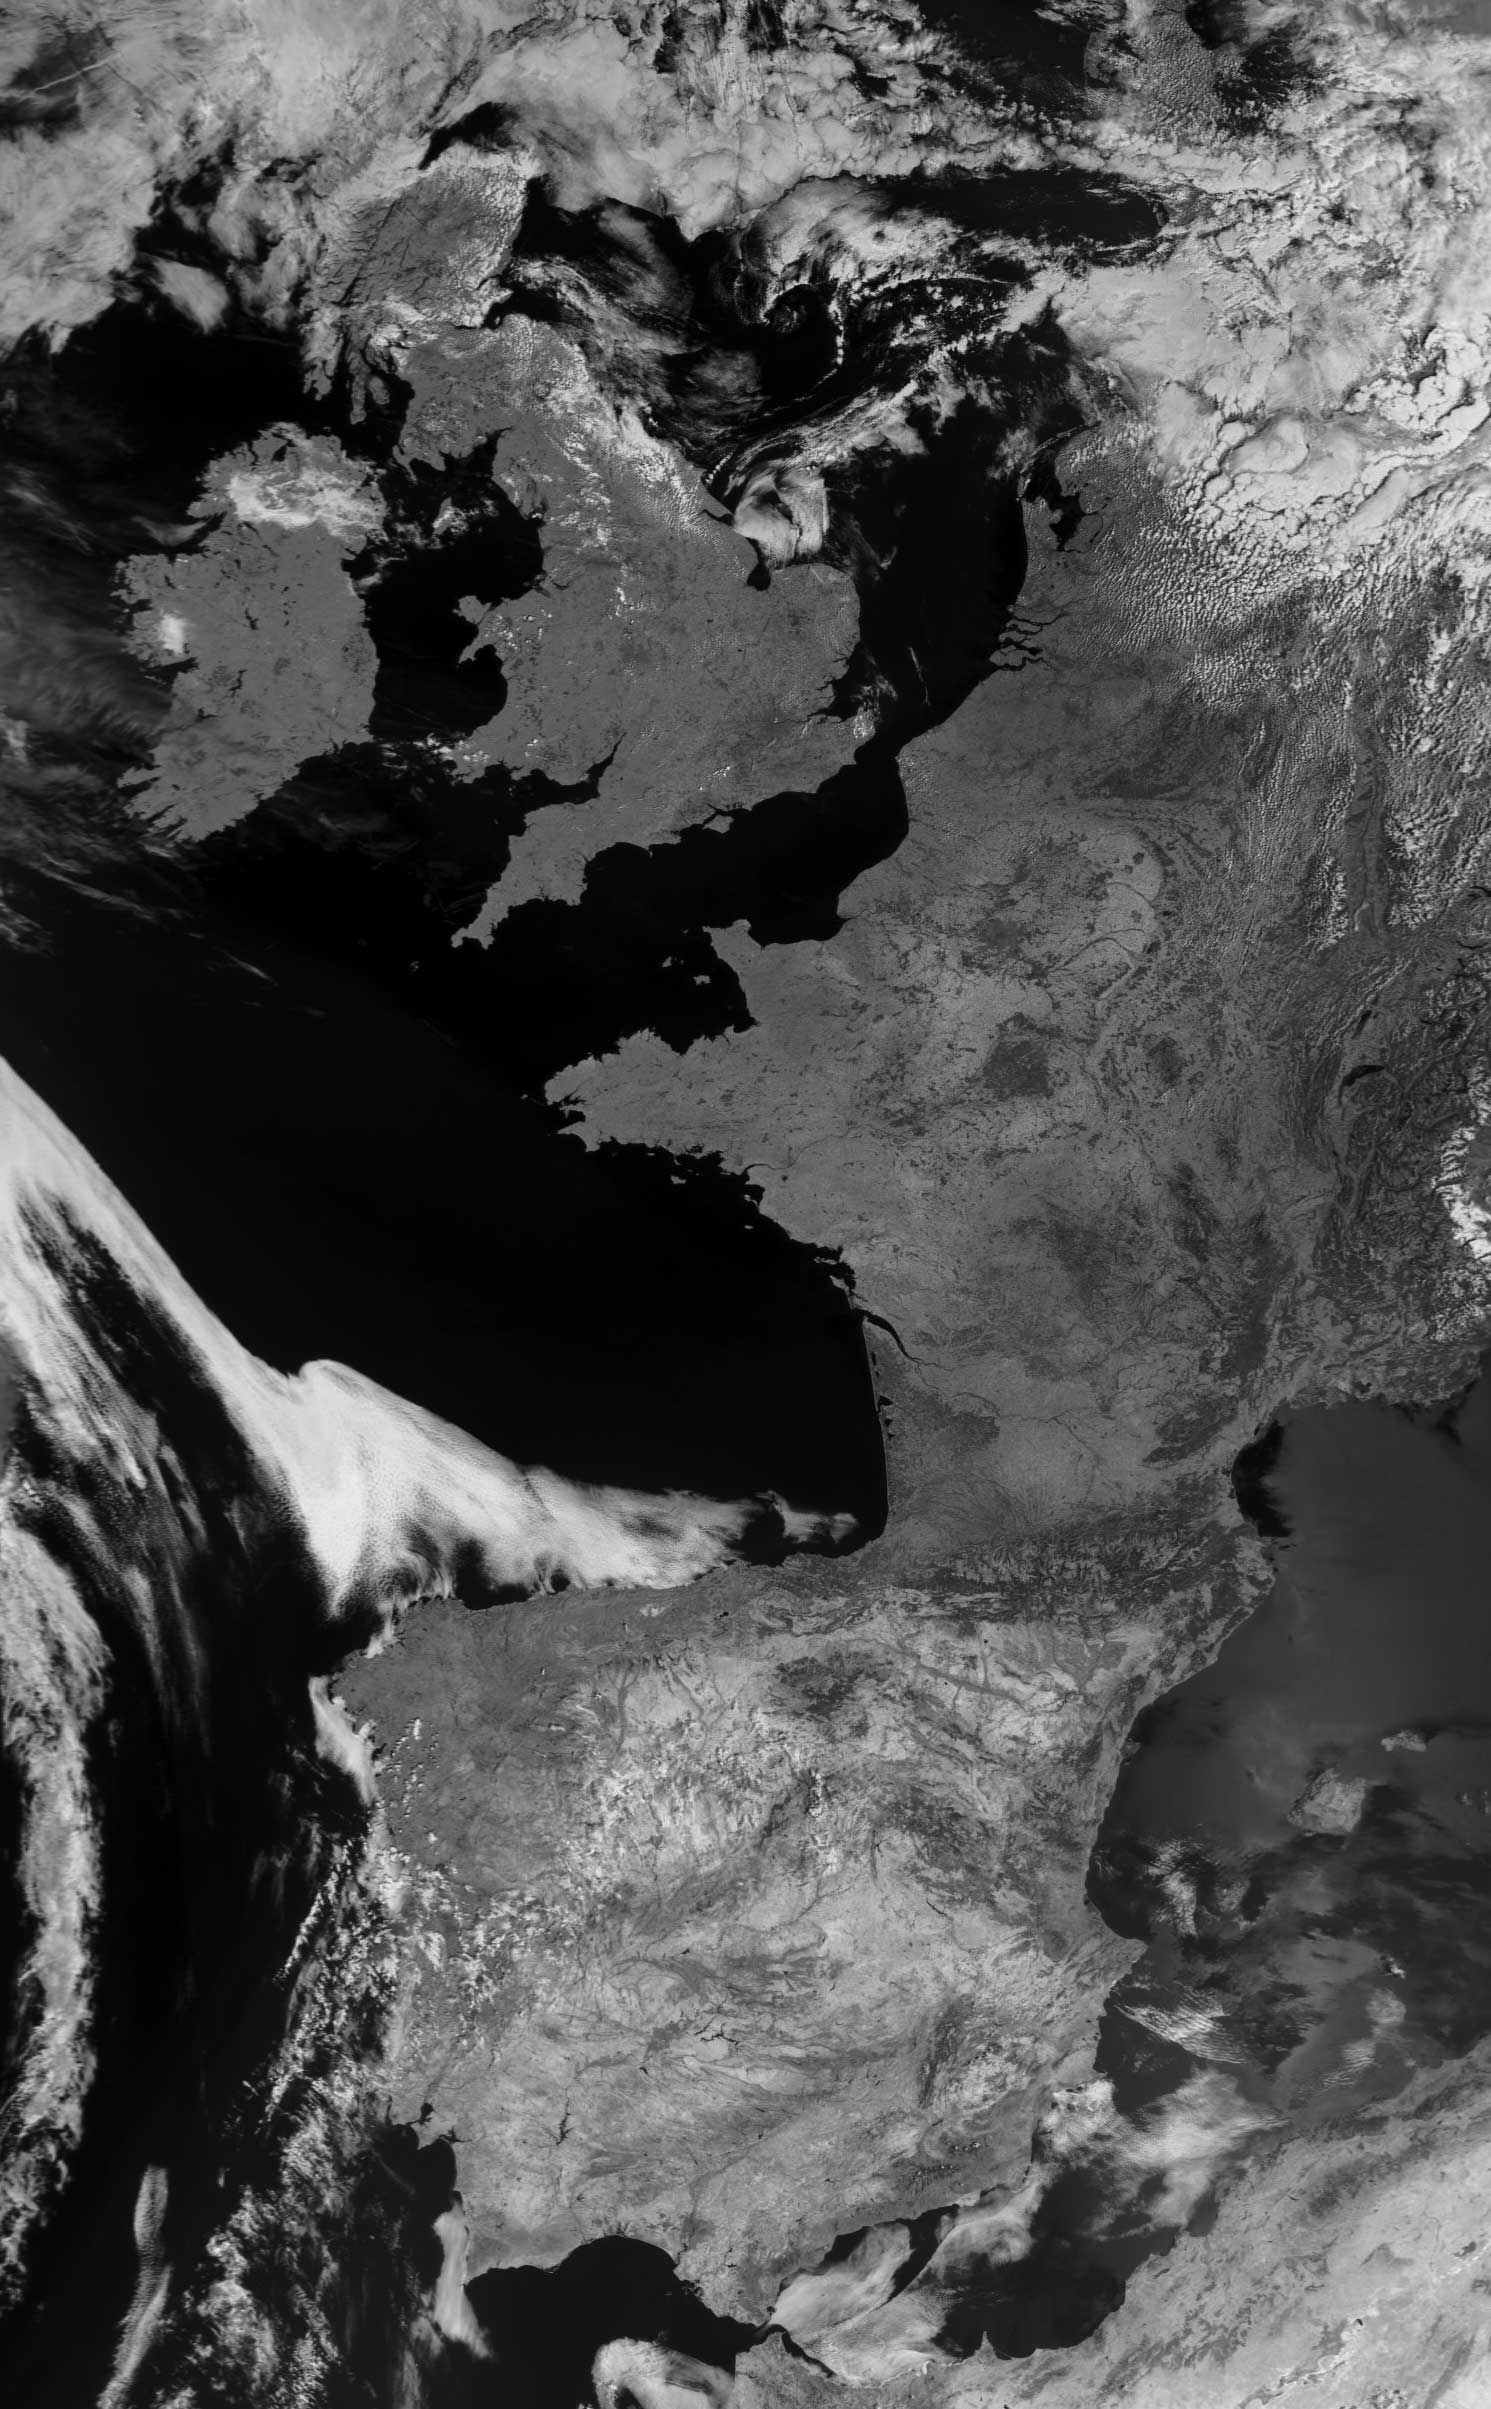
Southbound Metop-A pass at 09.59 UT on August 10, 2012
 |
 |
 |
| Channel 1 | Channel-2 | |
 |
 |
|
| Channel 3 | Channel-4 | Channels 2+4 colour composite |
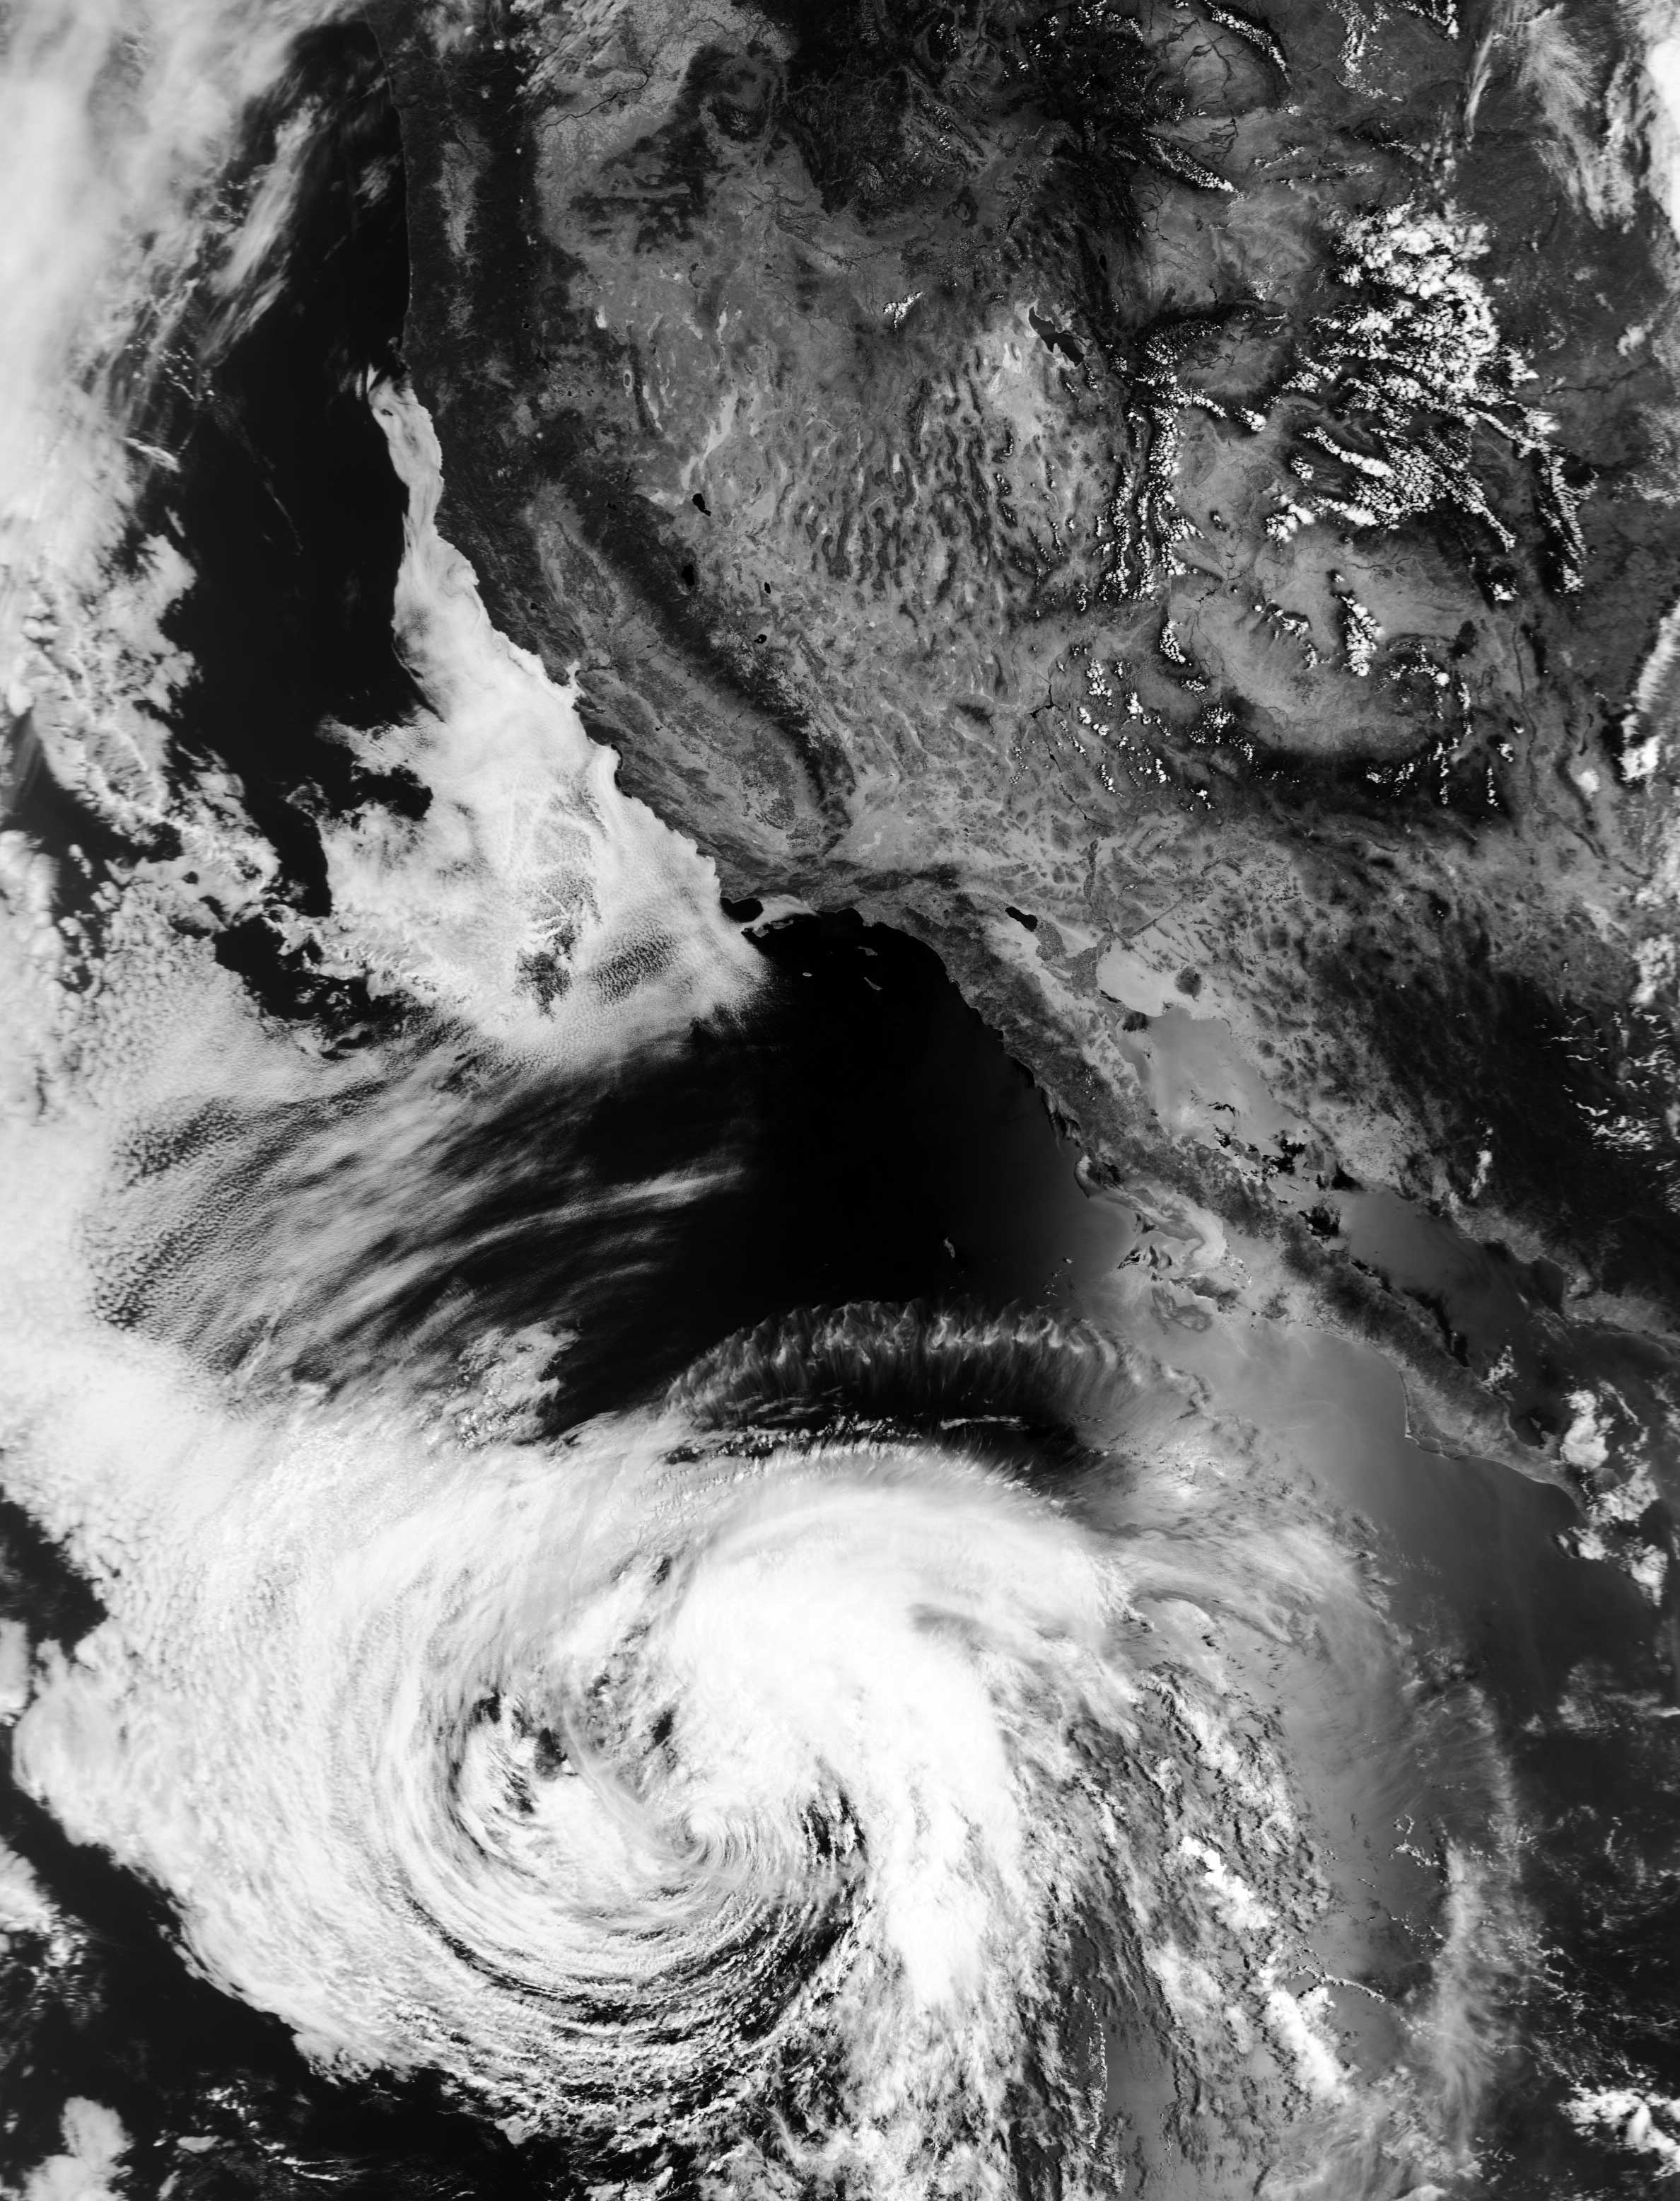
Southbound Metop-A pass at 17.25 UT on August 26, 2009
 |
 |
 |
| Channel 1 | Channel-2 | |
 |
 |
|
| Channel 3 | Channel-4 | Channels 2+4 colour composite |